Dissertation with Lifemote
Wi-Fi failure archetypes
For my MSc dissertation I worked with Lifemote, a company that analyses Wi-Fi telemetry from home routers for internet providers. A provider can usually see that a household's Wi-Fi is poor, but not why, so most poor connections get the same response. The project looked at whether the telemetry could be used to tell the causes apart.
- Context
- UCL MSc Business Analytics, industry dissertation with Lifemote
- Dates
- May to August 2026
- Team
- Individual
- Stack
- Python, pandas, scikit-learn
Preparing the data
I spent a large part of the project on the data before fitting any model. I removed every field derived from the quality label I planned to validate against, so the model could not learn the answer indirectly. I also found sentinel values in the raw telemetry, caused by integer overflow, that would otherwise have been read as real measurements.
The rest of the preparation covered winsorising extreme values, log transforms, ordinal encoding, and imputation that treated "fault not present" differently from data that was simply missing.
Modelling
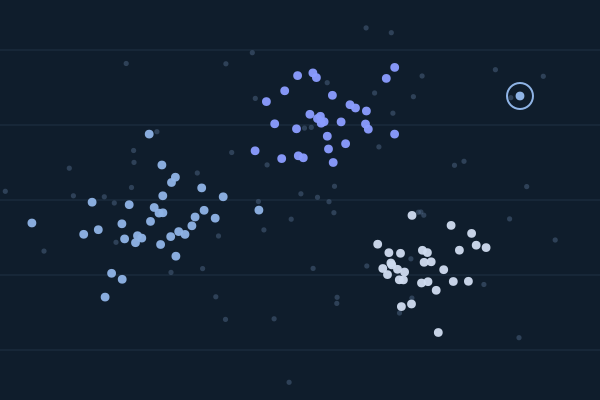
The modelling ran in two stages. After reducing the engineered features with PCA, a first K-means model separated healthy routers from degraded ones. I then refitted PCA on the degraded routers alone and clustered them again to group them by likely cause, comparing K-means against a Gaussian mixture model at that step.
Hardware faults did not form a cluster of their own, because they show up in the telemetry differently from the other problems. I handled them with a separate rule-based check rather than forcing them into the clustering.
Checking the results
I checked the clusters in three ways:
- with internal measures: silhouette, Davies-Bouldin and Calinski-Harabasz;
- against a held-out quality label that the model never saw during training;
- by scoring a separate week of data through the frozen pipeline, without refitting, to see whether the groups held up over time.
From clusters to a plan
The last step ranked each failure type by how common it was, how severe and how fixable, and matched each one to a likely fix: a remote configuration change, an advisory contact or an engineer visit.
The pipeline uses fixed seeds and saves the fitted scaler, PCA and model objects, so a new week of data can be scored with transform and predict only. It runs on a single ordinary machine and could be scheduled as a weekly batch job.
Using AI tools
I used Claude and Gemini to help with code and drafting, and wrote a statement of how I used them and how I checked their output. I relied on assertions in code rather than reading results by eye.
At one point the tools kept steering me towards choosing the number of clusters by silhouette score alone. That would have produced small, overlapping groups that no one could act on, so I made the choice on wider statistical grounds instead.
The data and the findings are confidential to Lifemote, so this page describes the method only.